JFreeChart – 气泡图
JFreeChart – 气泡图
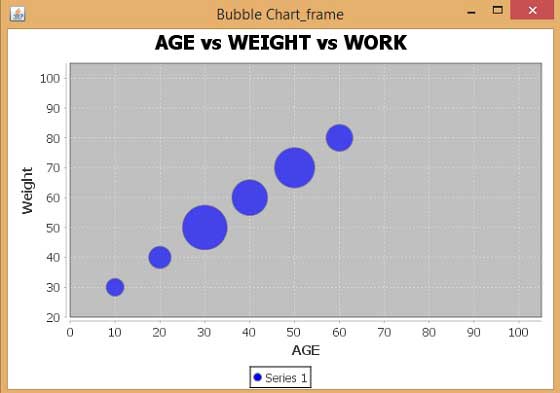
本章演示如何使用 JFreeChart 根据给定的业务数据集创建气泡图。气泡图以三维方式显示信息。在 (x, y) 坐标相交的位置绘制气泡。气泡的大小被认为是 X 轴和 Y 轴的范围或数量。
业务数据
让我们考虑不同的人以及他们的年龄、体重和工作能力。炒锅容量可以被视为小时数,在图表中绘制为气泡。
| WEIGHT | ||||||||
|---|---|---|---|---|---|---|---|---|
| AGE | 30 | 40 | 50 | 60 | 70 | 80 | ||
| 10 | 4 | 工作 | ||||||
| 20 | 5 | |||||||
| 30 | 10 | |||||||
| 40 | 8 | |||||||
| 50 | 9 | |||||||
| 60 | 6 | |||||||
基于 AWT 的应用程序
以下是根据上述信息创建气泡图的代码。此代码可帮助您在任何基于 AWT 的应用程序中嵌入气泡图。
import java.awt.Color;
import java.awt.Dimension;

import javax.swing.JPanel;

import org.jfree.chart.*;
import org.jfree.chart.axis.NumberAxis;
import org.jfree.chart.plot.PlotOrientation;
import org.jfree.chart.plot.XYPlot;
import org.jfree.chart.renderer.xy.XYItemRenderer;
import org.jfree.data.xy.DefaultXYZDataset;
import org.jfree.data.xy.XYZDataset;
import org.jfree.ui.ApplicationFrame;
import org.jfree.ui.RefineryUtilities;

public class BubbleChart_AWT extends ApplicationFrame {

   public BubbleChart_AWT( String s ) {
      super( s );
      JPanel jpanel = createDemoPanel( );
      jpanel.setPreferredSize(new Dimension( 560 , 370 ) );
      setContentPane( jpanel );
   }

   private static JFreeChart createChart( XYZDataset xyzdataset ) {
      JFreeChart jfreechart = ChartFactory.createBubbleChart(
         "AGE vs WEIGHT vs WORK",
         "Weight",
         "AGE",
         xyzdataset,
         PlotOrientation.HORIZONTAL,
         true, true, false);

      XYPlot xyplot = ( XYPlot )jfreechart.getPlot( );
      xyplot.setForegroundAlpha( 0.65F );
      XYItemRenderer xyitemrenderer = xyplot.getRenderer( );
      xyitemrenderer.setSeriesPaint( 0 , Color.blue );
      NumberAxis numberaxis = ( NumberAxis )xyplot.getDomainAxis( );
      numberaxis.setLowerMargin( 0.2 );
      numberaxis.setUpperMargin( 0.5 );
      NumberAxis numberaxis1 = ( NumberAxis )xyplot.getRangeAxis( );
      numberaxis1.setLowerMargin( 0.8 );
      numberaxis1.setUpperMargin( 0.9 );

      return jfreechart;
   }

   public static XYZDataset createDataset( ) {
      DefaultXYZDataset defaultxyzdataset = new DefaultXYZDataset();
      double ad[ ] = { 30 , 40 , 50 , 60 , 70 , 80 };
      double ad1[ ] = { 10 , 20 , 30 , 40 , 50 , 60 };
      double ad2[ ] = { 4 , 5 , 10 , 8 , 9 , 6 };
      double ad3[][] = { ad , ad1 , ad2 };
      defaultxyzdataset.addSeries( "Series 1" , ad3 );

      return defaultxyzdataset;
   }

   public static JPanel createDemoPanel( ) {
      JFreeChart jfreechart = createChart( createDataset( ) );
      ChartPanel chartpanel = new ChartPanel( jfreechart );

      chartpanel.setDomainZoomable( true );
      chartpanel.setRangeZoomable( true );

      return chartpanel;
   }

   public static void main( String args[ ] ) {
      BubbleChart_AWT bubblechart = new BubbleChart_AWT( "Bubble Chart_frame" );
      bubblechart.pack( );
      RefineryUtilities.centerFrameOnScreen( bubblechart );
      bubblechart.setVisible( true );
   }
}
让我们将上述 Java 代码保存在BubbleChart_AWT.java文件中,然后根据提示的命令编译并运行它 –
$javac BubbleChart_AWT.java
$java BubbleChart_AW
如果一切正常,它将编译并运行以生成以下气泡图 –
JPEG 图像创建
让我们重新编写上面的示例以从命令行生成 JPEG 图像。
import java.io.*;

import java.awt.Color;

import org.jfree.chart.*;
import org.jfree.chart.axis.NumberAxis;
import org.jfree.chart.plot.PlotOrientation;
import org.jfree.chart.plot.XYPlot;
import org.jfree.chart.renderer.xy.XYItemRenderer;
import org.jfree.data.xy.DefaultXYZDataset;
import org.jfree.chart.ChartUtilities;

public class BubbleChart_image {

   public static void main( String args[ ] )throws Exception {
      DefaultXYZDataset defaultxyzdataset = new DefaultXYZDataset( );
      double ad[ ] = { 30 , 40 , 50 , 60 , 70 , 80 };
      double ad1[ ] = { 10 , 20 , 30 , 40 , 50 , 60 };
      double ad2[ ] = { 4 , 5 , 10 , 8 , 9 , 6 };
      double ad3[ ][ ] = { ad , ad1 , ad2 };
      defaultxyzdataset.addSeries( "Series 1" , ad3 );

      JFreeChart jfreechart = ChartFactory.createBubbleChart(
         "AGE vs WEIGHT vs WORK",
         "Weight",
         "AGE",
         defaultxyzdataset,
         PlotOrientation.HORIZONTAL,
         true, true, false);

      XYPlot xyplot = ( XYPlot )jfreechart.getPlot( );
      xyplot.setForegroundAlpha( 0.65F );
      XYItemRenderer xyitemrenderer = xyplot.getRenderer( );
      xyitemrenderer.setSeriesPaint( 0 , Color.blue );
      NumberAxis numberaxis = ( NumberAxis )xyplot.getDomainAxis( );
      numberaxis.setLowerMargin( 0.2 );
      numberaxis.setUpperMargin( 0.5 );
      NumberAxis numberaxis1 = ( NumberAxis )xyplot.getRangeAxis( );
      numberaxis1.setLowerMargin( 0.8 );
      numberaxis1.setUpperMargin( 0.9 );

      int width = 560;   /* Width of the image */
      int height = 370;  /* Height of the image */
      File bubbleChart = new File("BubbleChart.jpeg");
      ChartUtilities.saveChartAsJPEG(bubbleChart,jfreechart,width,height);
   }
}
让我们将上述 Java 代码保存在BubbleChart_image.java文件中,然后从提示的命令编译并运行它 –
$javac BubbleChart_image.java
$java BubbleChart_image
如果一切正常,它将编译并运行以在当前目录中创建一个名为BubbleChart.jpeg的 JPEG 图像文件。
